Analytics and reports
Explore link and keyword analytics, export your data to CSV, and share public reports.
Linkwatcher turns your monitoring data into charts you can act on, CSV exports you can work with elsewhere, and shareable reports for clients or teammates.
Links analytics
Open Analytics > Links from the sidebar. The page starts with metric cards summarizing your link profile, followed by a set of charts:
- Dynamics: how your links evolve over time.
- New Links vs Issues: links added compared with problems detected, day by day.
- Anchor Cloud: a word cloud of the anchor texts pointing at your site.
- Links Breakdown and Anchor Category Breakdown: how your links split by status and by anchor type.
- Anchor and URL table: which anchors point to which pages.
- Pages Overview and Crawled Pages: the pages on your site receiving links and the referring pages Linkwatcher has crawled.
- World Map: where your referring pages are located.
Use the filters in the page header to focus on a specific team member or a custom date range; every chart updates to match.
Note: Analytics pages are not available on the Free plan. If your workspace is on a Free plan you are redirected to the dashboard when opening them.
Keywords analytics
Open Analytics > Keywords to analyze your tracked rankings with the keyword rank monitor. The page includes daily position changes, a position distribution, top performing keywords, a keyword volatility meter, SERP features distribution, and a location comparison so you can compare rankings across the locations you track.
Users overview
Analytics > Users breaks performance down by team member: link contributions, links dynamics per user, found and do-follow totals, issues, indexing ratio, and a KPI calendar. This is useful when several people add links to the same project.
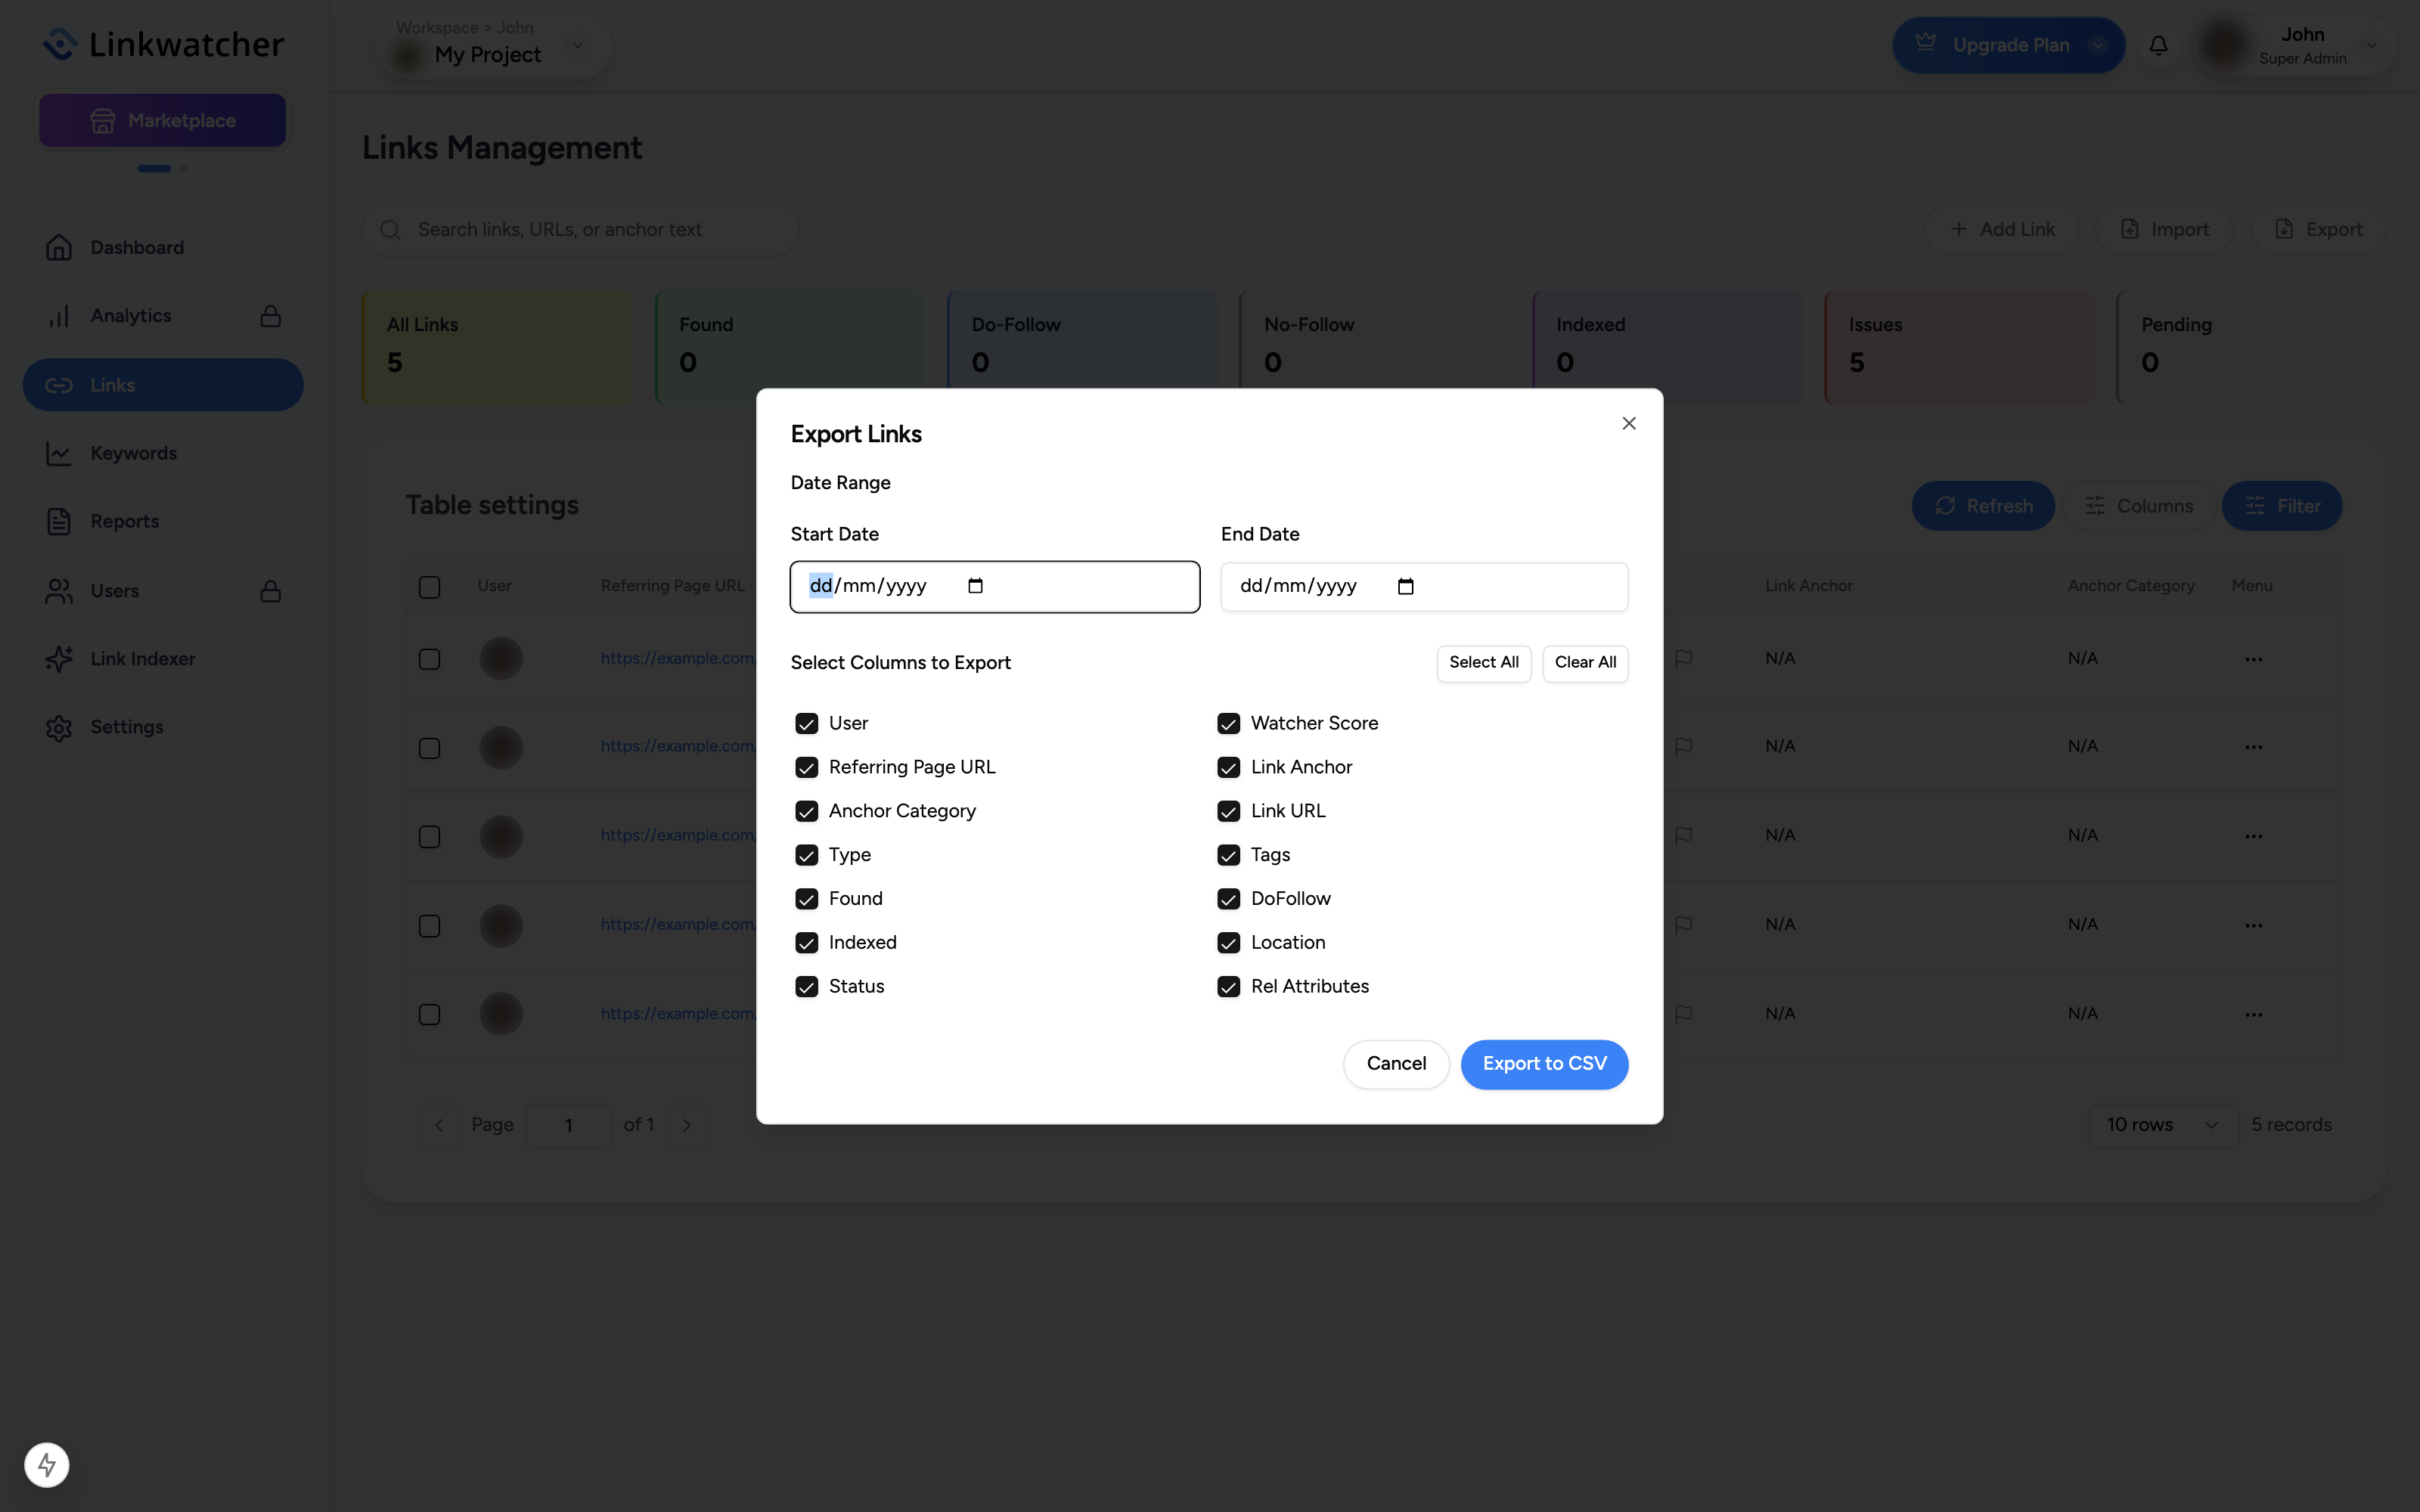
Exporting links to CSV
- Go to the Links page and click Export in the top right.
- Optionally set a Start Date and End Date to limit the export.
- Tick the columns you want, or use Select All / Clear All.
- Click Export to CSV. The file downloads to your computer.
The Keywords page has the same Export option for your rank tracking data.
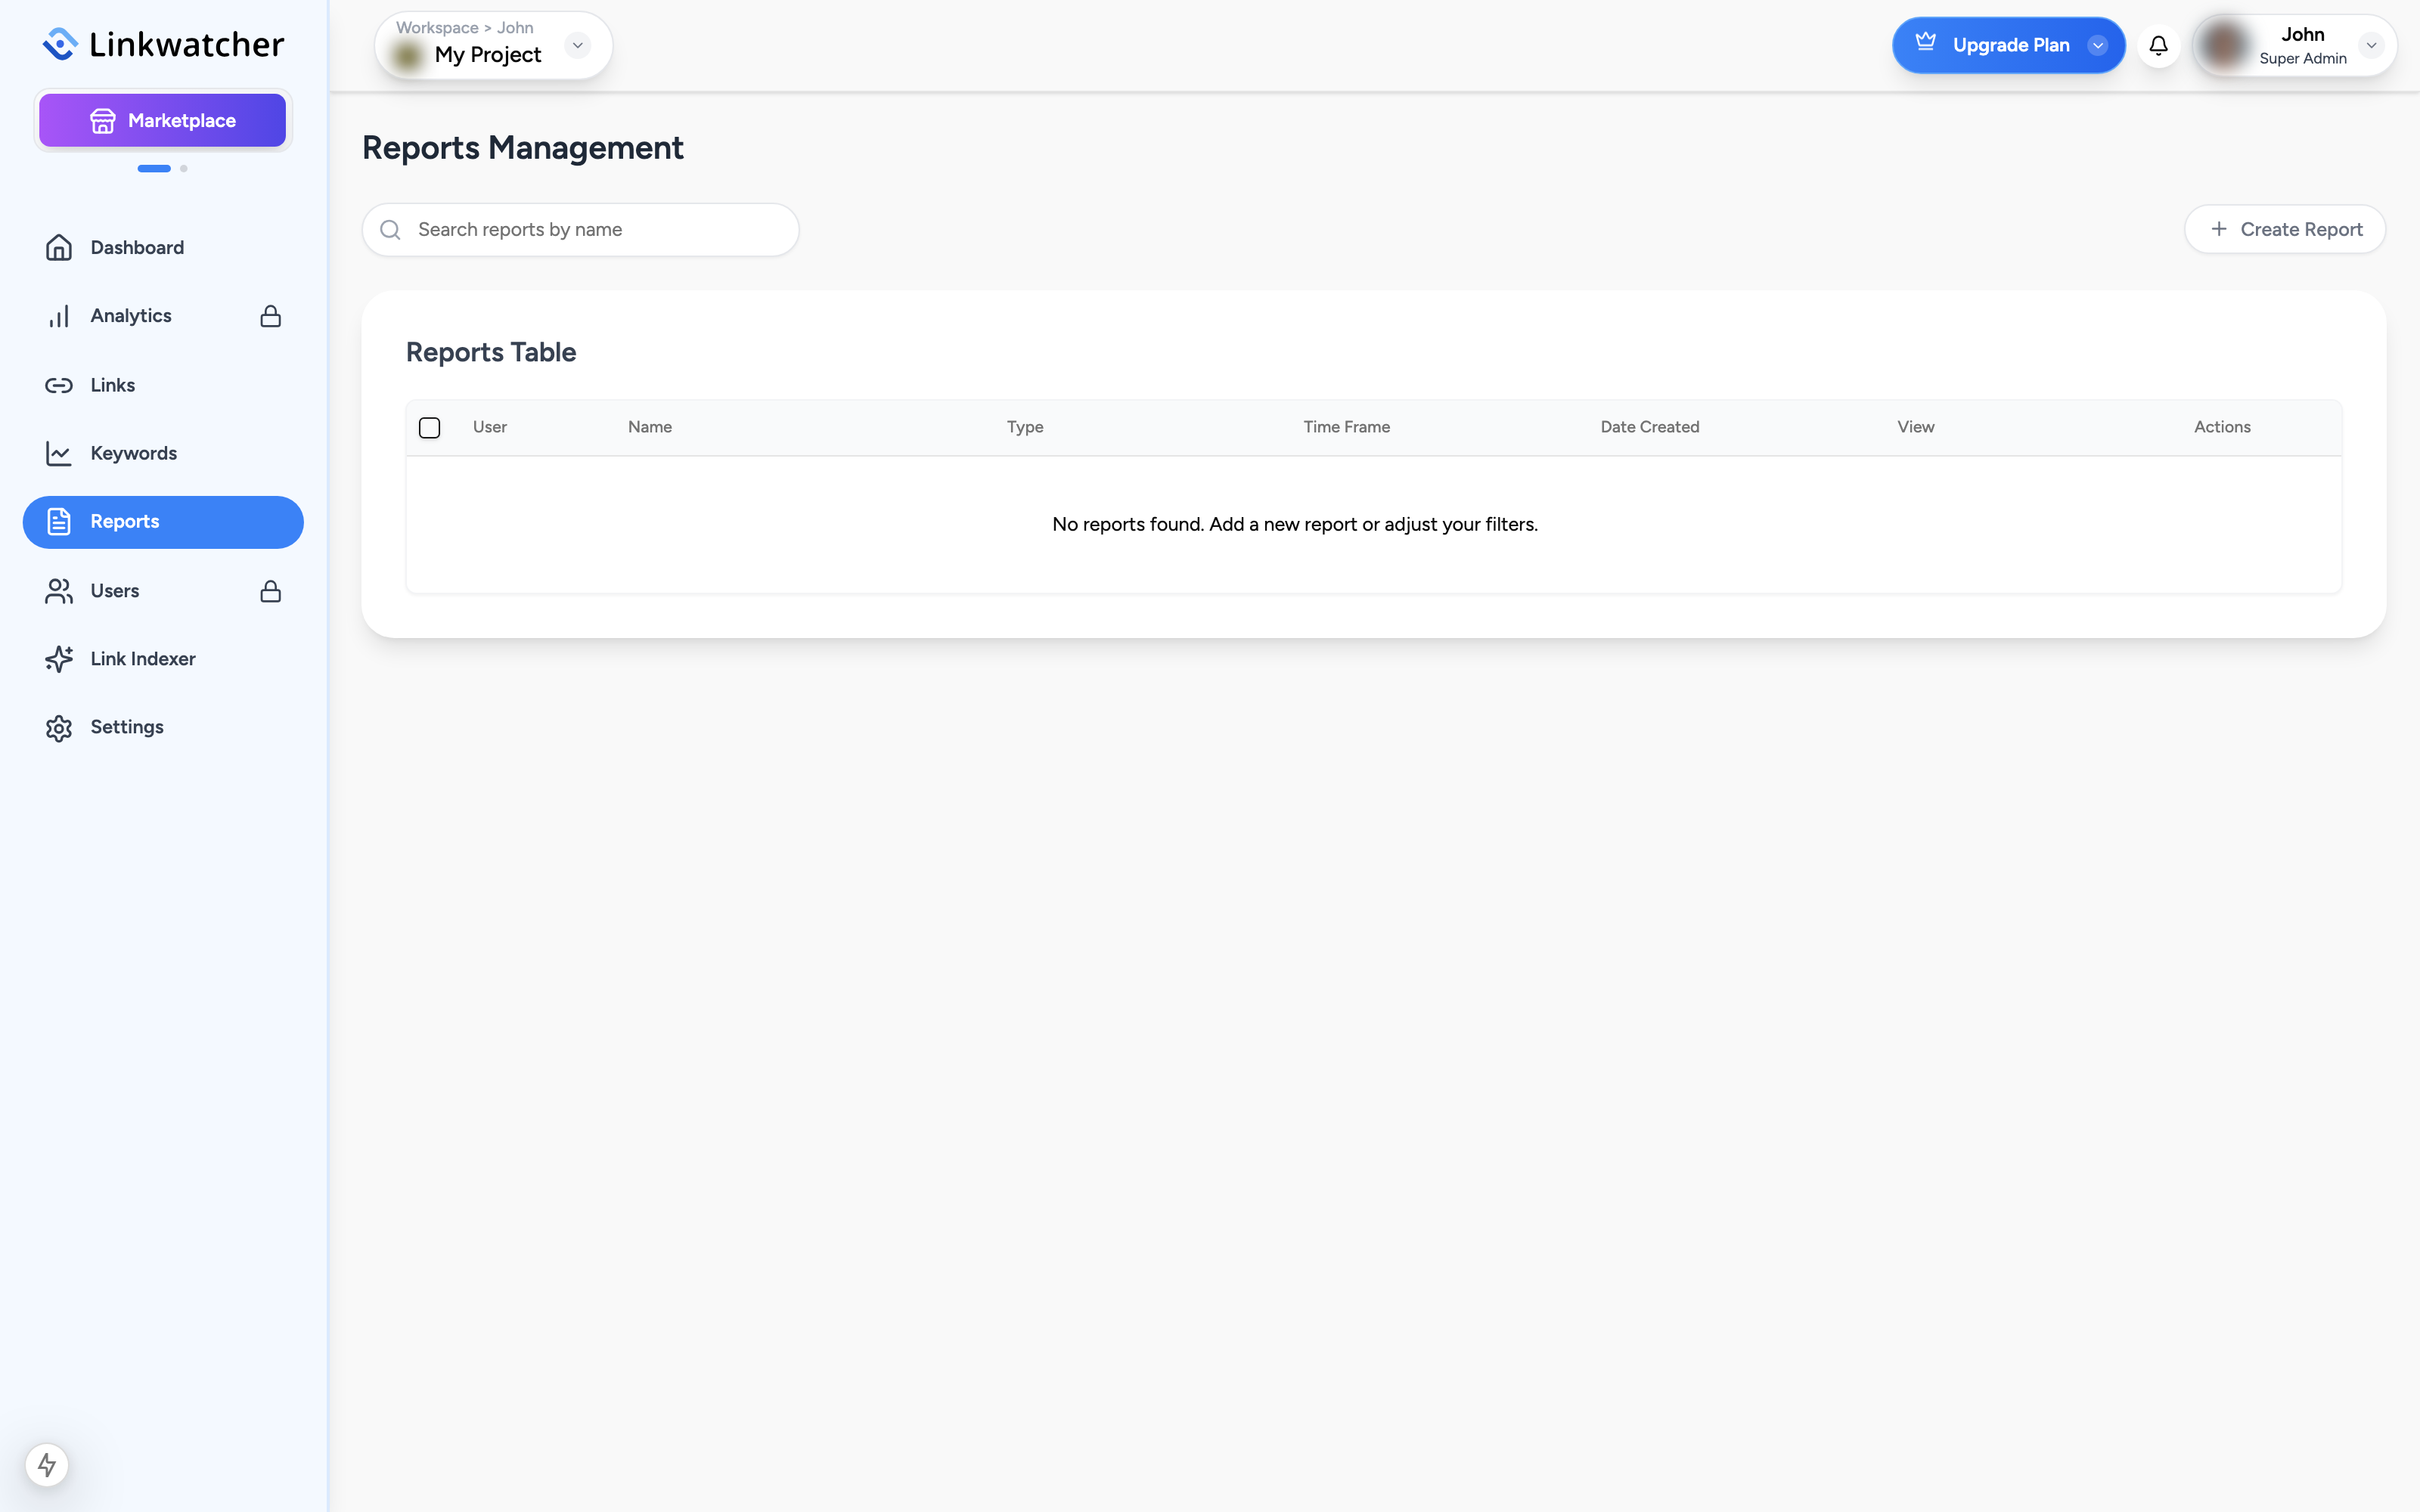
Shareable reports
Reports give people outside your workspace a read-only view of your data through a public link.
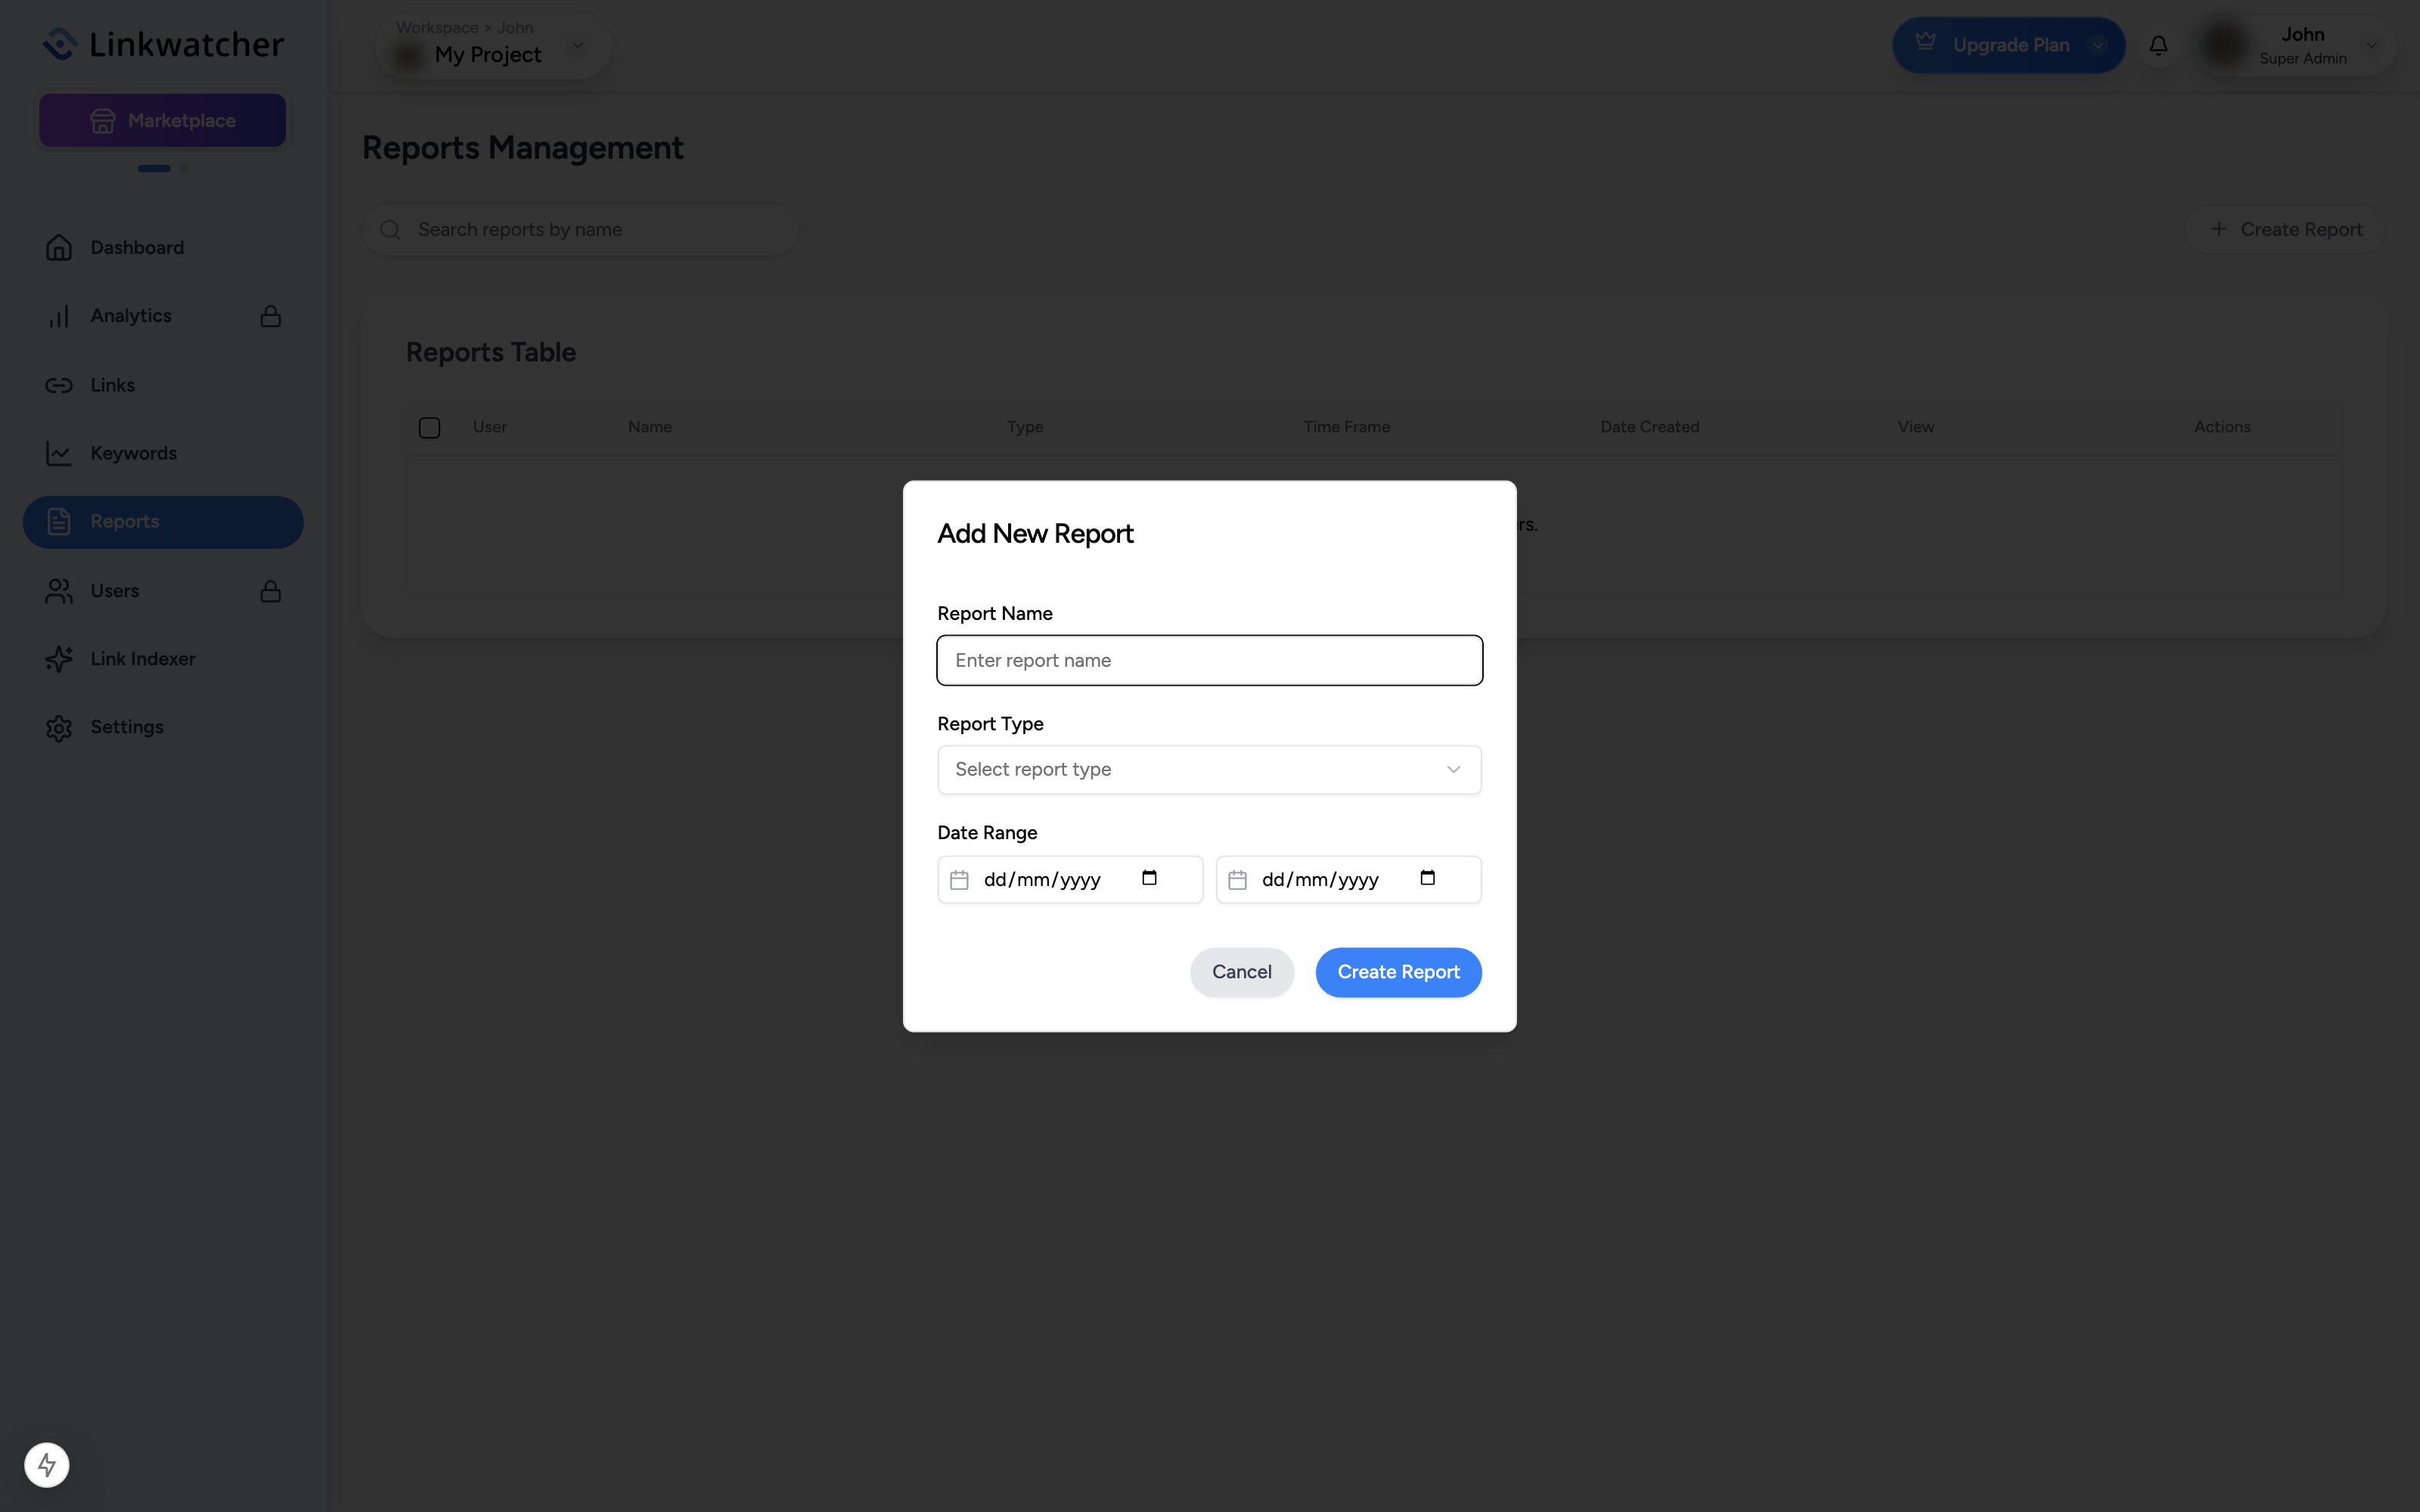
- Open Reports in the sidebar and click the button to add a report.
- Enter a Report Name.
- Choose a Report Type: Links Overview or Rank monitor Overview.
- Pick a Date Range and click Create Report.
- When the report is created you can click View Report to open it, or Copy Report Link to copy the public URL to your clipboard.
Existing reports are listed in a table showing name, type, time frame, and creation date. Each row has a View button that opens the public page and a Copy button for the share link.
Note: Anyone with the report link can view it, so only share it with people who should see that data.
Email reports
For recurring summaries delivered to your inbox, enable Email Reports under Settings > Project Settings and pick Daily, Weekly, or Monthly delivery for Links and for Keywords.